Calculating Your Carbon Footprint: A Guide to Measuring Serverless App Emissions on AWS
NTT Data is a leading global provider of end-to-end ICT services. Their comprehensive use case illustrates how to address the environmental metric challenges of serverless computing.

Serverless applications, known for their scalability and efficiency, present unique opportunities and challenges in sustainability.
As part of a project measuring the impact of various Green Software Patterns on reducing carbon emissions, NTT Data developed a comprehensive methodology for quantifying the carbon footprint of these applications.
Denis Angeletta and Franziska Warncke, co-lead for the Green Software Patterns project, share the results achieved by applying the SCI specification and highlight how low per-request emissions can quickly scale to significant levels (305 kg of CO2 for 1M requests) for high-traffic applications.
The Challenge: Assessing the Environmental Impact of Serverless
Serverless computing has revolutionized how we deploy and scale applications, offering a high degree of operational flexibility and cost efficiency. However, this paradigm shift is not without its challenges, especially when it comes to environmental impact assessments such as carbon emissions. Two significant hurdles in this domain are the delay in availability and the difficulty in collecting relevant metrics.
Delay in Metrics Availability: The Data Refresh Interval Challenge
In services like DynamoDB, metrics such as table size are updated only every six hours. This infrequent update cycle can lead to significant delays in obtaining crucial metrics. Such delays are particularly problematic when immediate data analysis is required for performance tuning or cost optimization. The inherent lag in data refresh rates necessitates a proactive approach to data management, ensuring that strategies are in place to mitigate the impact of these intervals on system monitoring and operational efficiency.
Collecting Relevant Metrics: A Data Dilemma
Serverless architectures abstract away much of the underlying infrastructure, which can obscure the data needed for accurate SCI calculations. Metrics such as the exact energy usage of a function, the hardware specifications of the underlying servers, and the carbon intensity of the electricity used are often not readily available to the end-user. This lack of transparency necessitates reliance on estimates or averages provided by the cloud service provider, which may not always reflect the true carbon footprint of the serverless functions.
Example Architecture for Measuring Serverless Application
As a basis for our measurements, we have built a comprehensive Campaign Management System designed to streamline and optimize campaigns. Campaign management involves planning, executing, and analyzing marketing strategies to promote products or services effectively. Utilizing a serverless architecture for campaign management is advantageous due to its scalability, allowing systems to automatically adjust to fluctuating workloads during peak times. This cost-effective model charges only for actual compute usage, which is ideal for handling varying campaign activity. Additionally, serverless solutions enable rapid feature deployment and seamless integration with third-party services, enhancing agility and responsiveness—critical factors in the fast-paced marketing landscape.
Sustainability is a key consideration, especially during running campaigns when managing access requests becomes critical.
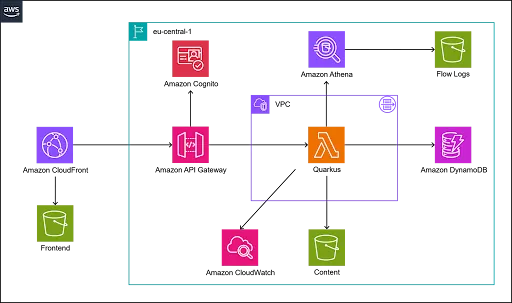
The architecture of the system relies on popular serverless solutions available in AWS, such as Lambda for backend processing, DynamoDB for campaign data storage, S3 for static content storage and frontend deployment, and API Gateway for managing access to the backend. The chosen CPU architecture for all components is the default, which is the x86. These specific services were chosen because they are well-established in the industry and have been widely adopted by developers, making them an ideal basis for evaluating the CO2 emissions of serverless solutions.
Measurement Strategy
With the help of our SCI calculator, which is a tool to measure software carbon footprint and carbon intensity, we can approximate the carbon footprint of different hardware components based on the resource usage of the given serverless service.
In our first measurements, we focused on four key metrics:
- Allocated memory of a lambda function
- Total size in bytes of files inside a S3 bucket
- The table size of a DynamoDB table
- Network traffic in bytes via VPC Flow Logs
Because of the nature of the services, there are some significant challenges when it comes to collecting the relevant metrics to derive CO2 emissions. Nonetheless, it is possible to do so.
To generate load for the application to have comparable emission values, a load testing framework is used called k6. The load test is executed for one hour and creates multiple campaigns. After a successful run, an HTTP request is executed that returns the current SCI value for the given time range of the load test execution. In that logic, for each previously mentioned metric, the relevant resource consumption values are retrieved as follows: allocated memory of a Lambda function and total size in bytes of files inside an S3 bucket are obtained via CloudWatch; the table size of a DynamoDB table is retrieved directly from DynamoDB; and network traffic in bytes via VPC Flow Logs is accessed through Athena. With those values, the API from our tool asks for current emission values per component. With that, we can calculate the SCI.
The network emissions are not measured outside of the box. Therefore, a different kind of setup is needed. The first step is to gather bytes that traverse the application network. If this information is available, it is possible to transform this value with a specific formula from GSF, which is described here. After that, the carbon emissions can be combined with other components to calculate the SCI.
VPC flow logs can be used to get carbon emissions created by network traffic. The logs from your VPC can be stored in an S3 bucket, which can then be queried with Athena. In a log entry, we have the number of bytes sent per packet. That can be summed up for a given time range to get an idea of what the network emissions were.
The green software pattern “Reduce transmitted data” is a great option for comparing a multitude of different executions. Between the different executions, different image sizes can be uploaded. A larger image size that is uploaded through the creation of the campaign should not only cause higher network traffic but also increase the number of bytes that are stored in the different storage solutions used.
Together with k6 and AWS CodeBuild, the load test is executed to give us first insights about CO2 emissions in our serverless architecture.
The Results: Quantifying Carbon Footprint
Upon conducting a pattern test on the application, the results yielded a carbon footprint of 1099.81 grams of CO2 over the span of one hour, during which the application processed a total of 3603 requests. The carbon emissions per request can be calculated as approximately 0.305 grams of CO2 per request, offering a metric for assessing the efficiency and sustainability of the application. While this may seem small, it adds up significantly to high traffic. For instance, with 1 million requests, this amounts to 305 kilograms of CO2. Such measurements are crucial for identifying areas where improvements can be made to reduce the overall carbon footprint, aligning with goals for greener computing practices. This perspective helps highlight the importance of even small efficiencies in large-scale operations, ensuring meaningful impact.
When comparing different measurements with varying picture sizes, we observe that the “Reduce transmitted data” pattern can achieve approximately a 4% reduction in carbon emissions. This experiment is currently in progress and the results will be published in a future blog.
Looking Ahead
We plan to integrate the Real-Time Cloud Framework from the GSF into our approach for measuring carbon emissions. While this framework is implemented on AWS due to our use of specific AWS services, the aim is to expand this approach to include Azure and Google Cloud Platform (GCP). Additionally, we plan to measure various other patterns to gain a comprehensive understanding of these patterns and quantify the potential savings associated with each.
It’s important to mention that this paper targets x86_64 architecture. Future work will include comparisons with Arm architecture to provide a more comprehensive analysis.
Learn how to calculate the carbon intensity of a software application using the SCI specification.