Executive Summary
Intesa Sanpaolo (ISP), as a responsible business entity, acknowledges the importance of adopting sustainable practices to minimize its environmental impact. One of the key challenges that the bank faces in this regard is to track and measure energy consumption and carbon emissions associated with software and hardware usage. To address this challenge, Intesa Sanpaolo requires a monitoring tool that can provide accurate data on its environmental impact and help identify opportunities for improvement.
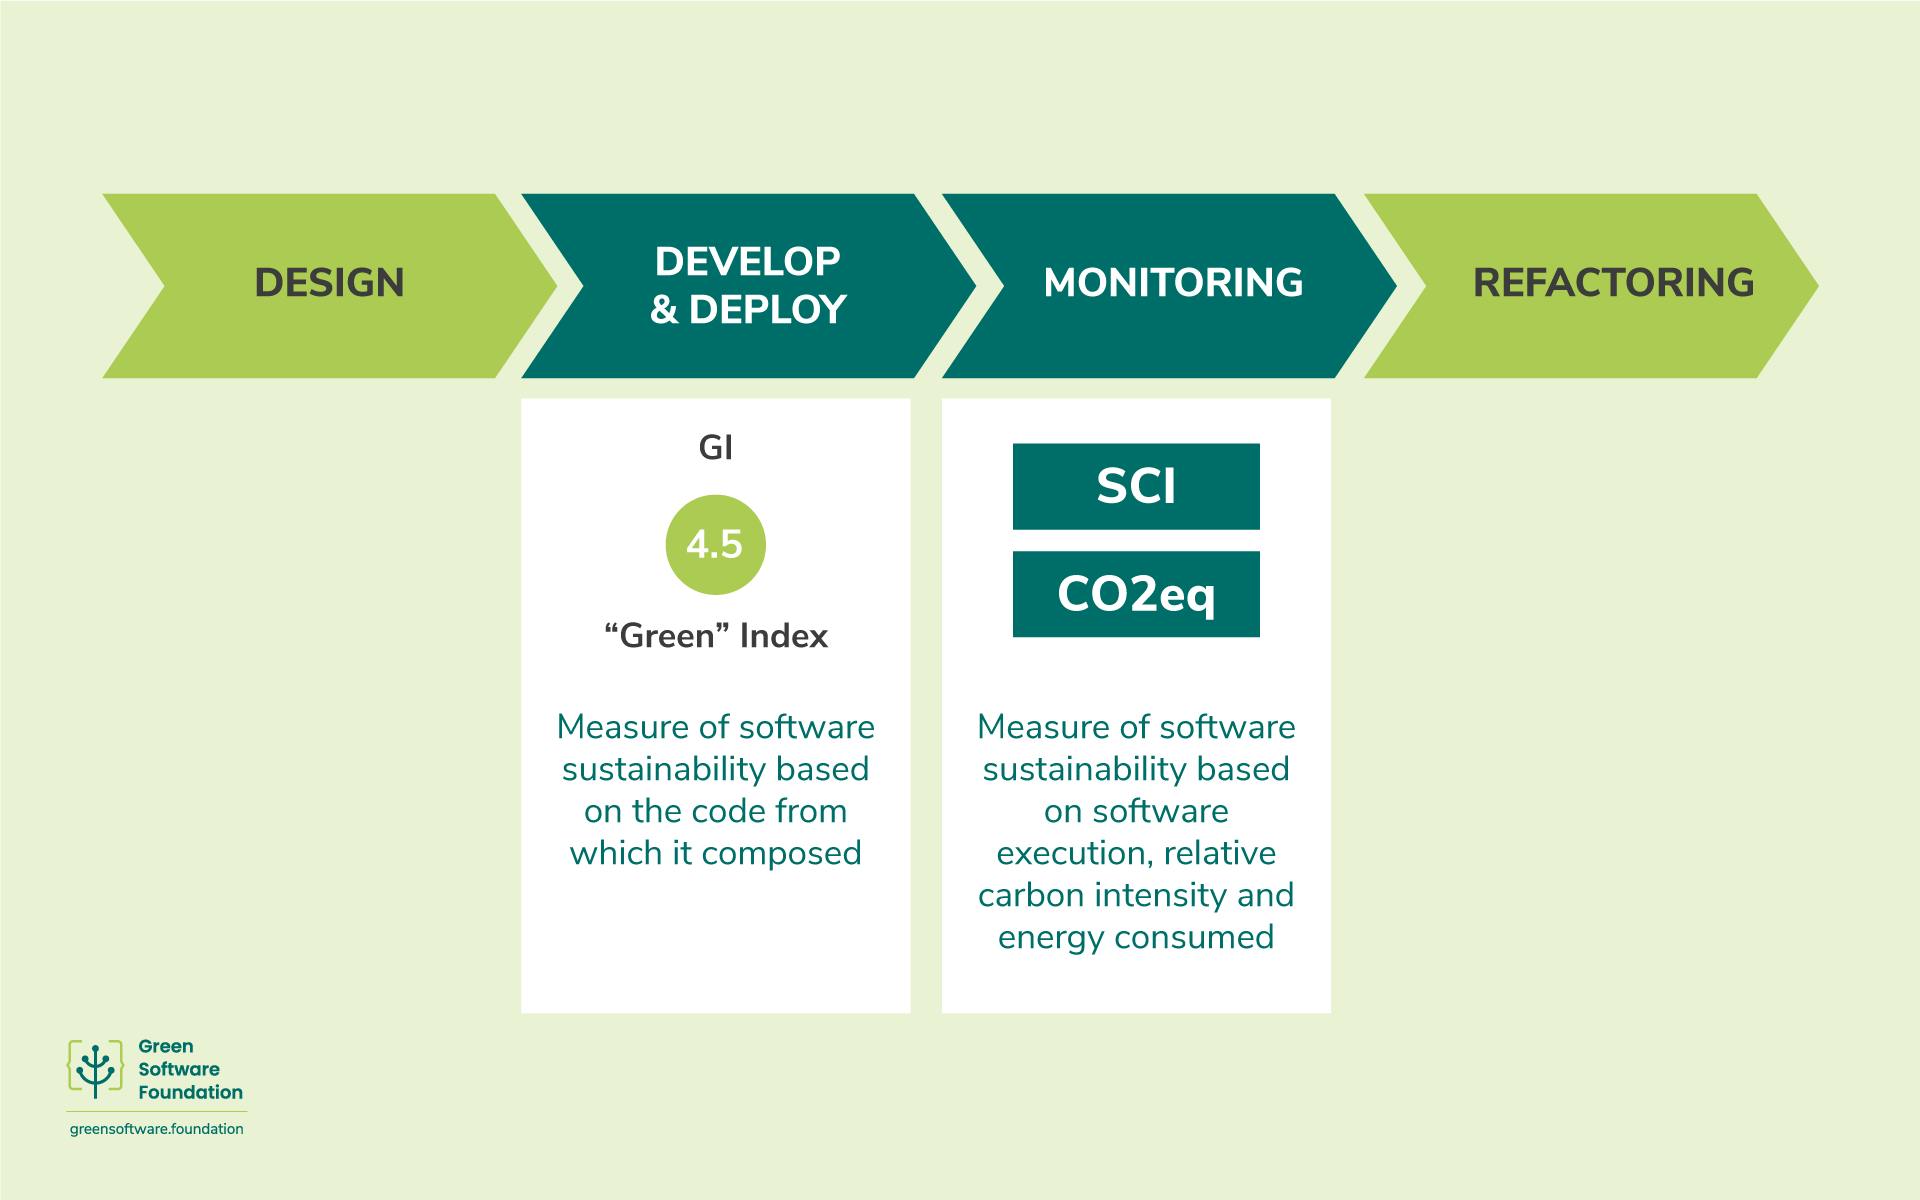
To tackle this need, NTT Data, as a leading IT services provider, has developed several assets framed in a conceptual framework based on 4 phases of intervention: Design, Development, Monitoring, Refactoring.

Following this framework, ISP started with Development and Monitoring phases.
In the context of development phase, ISP developed the Green Index, a measure of code sustainability that helps ensure our software products are more efficient and environmentally friendly.
In the context of monitoring phase, thanks to NTT Data’s proprietary monitoring tool Intesa Sanpaolo is currently able to track and monitor its IT’s energy and carbon footprint. The primary purpose of this tool is to help the bank gain a comprehensive understanding of its environmental impact and identify areas where it can reduce its carbon footprint and optimize its software and hardware usage.
The monitoring tool uses two main key performance indicators (KPIs): CO2eq for overall carbon emissions and SCI for emission rates, as recommended by the Green Software Foundation (GSF). By using these KPIs, the tool enables Intesa Sanpaolo to measure its carbon emissions and energy consumption accurately and identify opportunities for improvement.
Using these solutions, Intesa Sanpaolo has gained valuable insights into its energy and carbon footprint, aligning the IT Department with the bank's commitment to sustainability and responsible business practices, demonstrating its dedication to environmental stewardship and promoting sustainable growth.
Description of problem
As one of the largest banking institutions in Italy, Intesa Sanpaolo operates a complex network of IT systems that support its business operations. These systems include servers, storage devices, and other hardware components.
With the increasing focus on sustainability and the need to reduce carbon emissions, Intesa Sanpaolo recognized the importance of measuring and reducing the energy consumption and carbon emissions related to its IT systems. However, tracking these metrics across a large and complex IT infrastructure presented a significant challenge.
Intesa Sanpaolo's IT system managers understood the need to address the impact of IT systems on the environment, and their search for solutions focused on finding ways to reduce this impact while still meeting business needs. With a clear recognition of the importance of complying with the business plan, which included specific ESG goals, they sought to align the function of IT with the overall business strategy, and to identify opportunities for IT to contribute to the achievement of ESG objectives. This required a comprehensive understanding of the impact of IT systems on the environment, and a commitment to finding ways to reduce this impact while still maintaining effective and efficient business operations.
One of the challenges is to introduce a methodology for developing new software that is designed sustainably. Additionally, implementing a reliable and accurate monitoring tool to identify areas of high energy consumption and carbon emissions is essential to prioritize areas for improvement. This tool will serve as a compass for refactoring existing solutions in order to optimize energy efficiency and reduce the carbon footprint of Intesa Sanpaolo.
How the use case solves the problem
A more efficient IT is achieved through a recursive system that is based on four steps: Design, Develop, Measure and Refactor through improvement strategies, and implementing the improvement. The four steps are replicated, until the desired level of performance is achieved.

With the final objective of introducing software sustainability in the development phase, ISP introduced the Green Index, a measure of code sustainability that helps ensure software products are environmentally friendly and efficient. This indicator is used to measure how sustainable ISP developers (as well as partners & suppliers) are in writing code.
The score is based on static analysis of code, which is performed using SonarQube, a widely used code quality management tool that helps to continuously inspect code for bugs, vulnerabilities, and code smells. The rules used to calculate the Green Index are derived from the analysis of standards provided by the Consortium for Information and Software Quality (CISQ). The CISQ standards cover various aspects of software quality, such as security, maintainability, reliability, and efficiency, and are widely recognized and adopted in the software industry. By leveraging the power of SonarQube and the expertise of CISQ, software products can be not only functional and reliable but also environmentally friendly and efficient: in fact, with the Automated Source Code CISQ Performance Efficiency Measure (ASCPEM™) specification we can establish a standard measure of performance efficiency by detecting violations of good architectural and coding practices that may result in inefficient operation, such as performance degradation or excessive use of processor resources.[1]
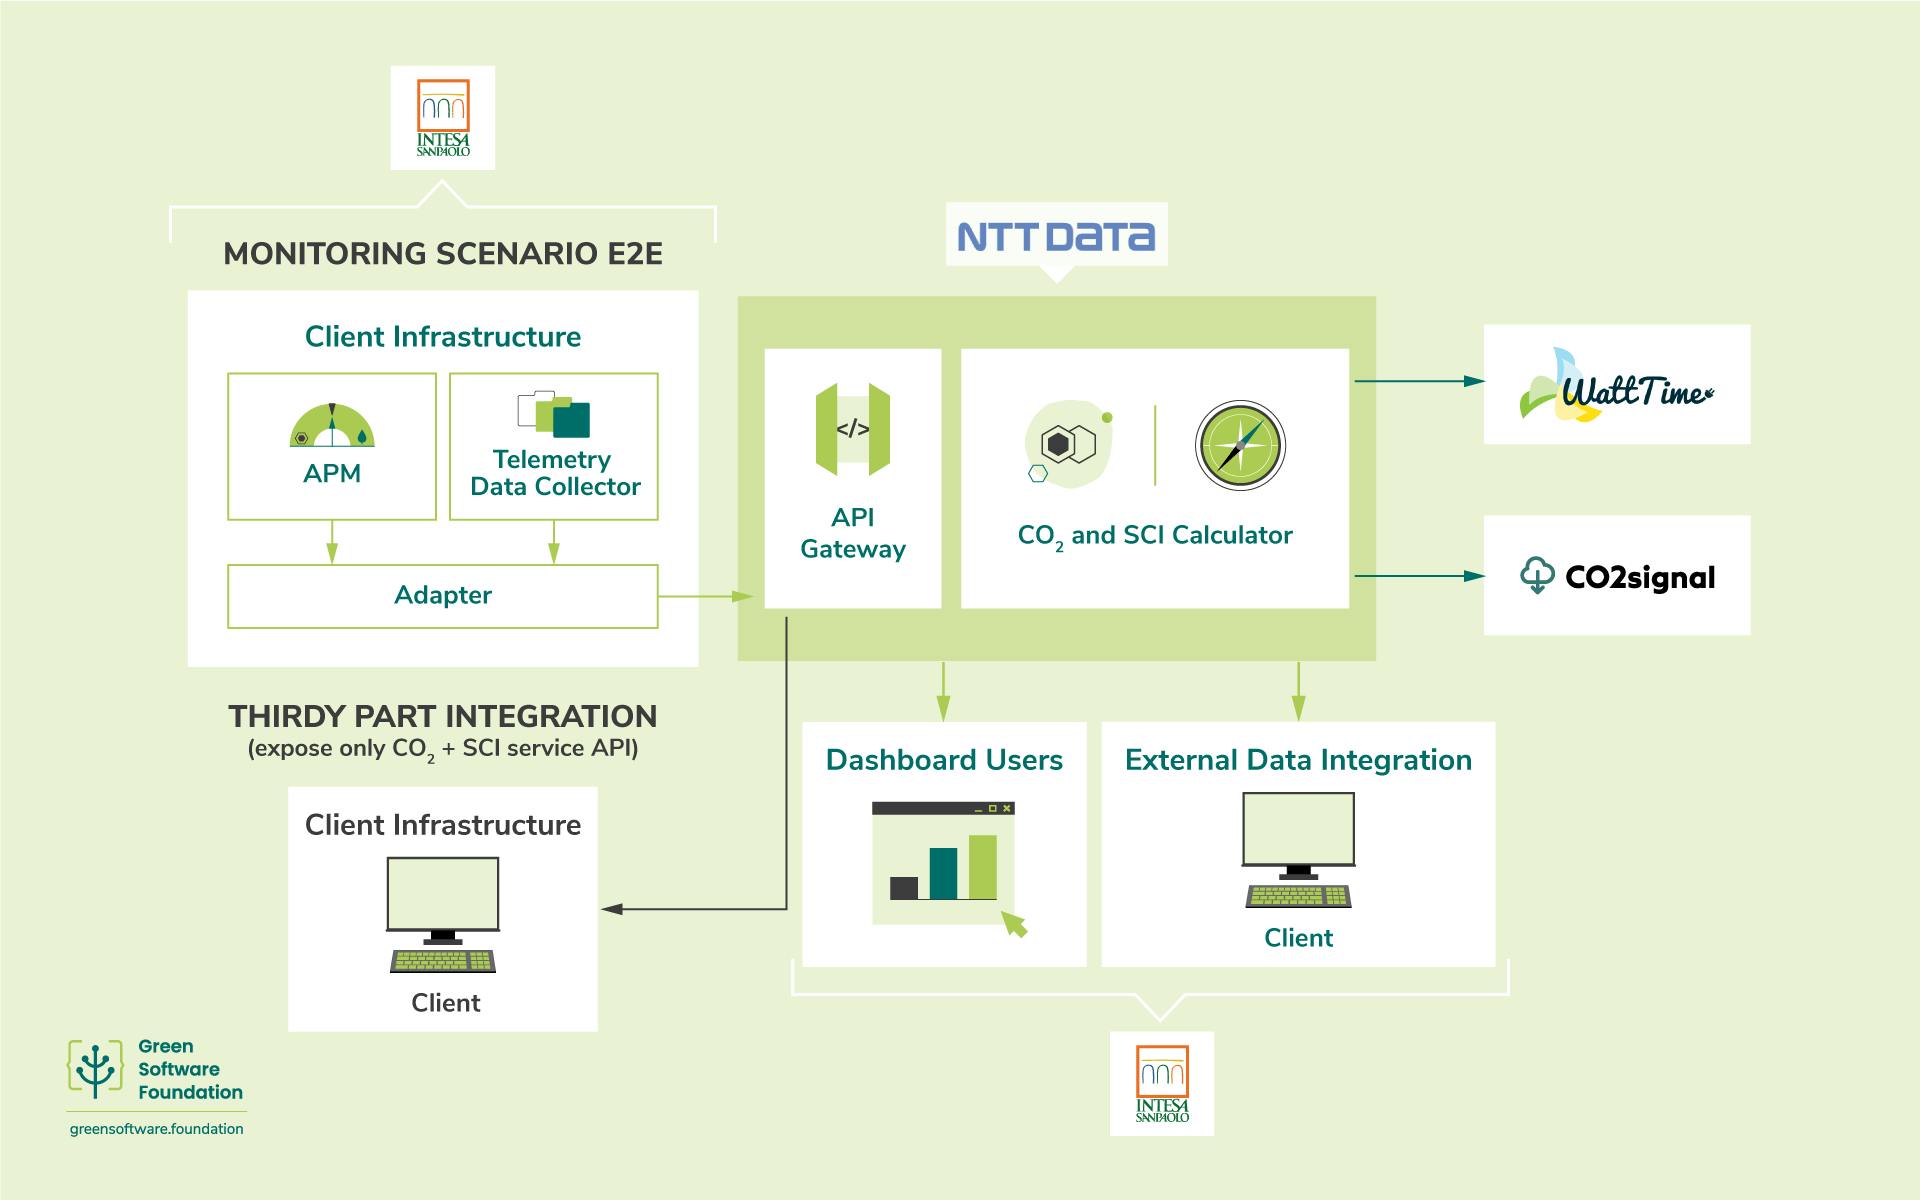
NTT Data worked closely with Intesa Sanpaolo to develop a comprehensive solution for monitoring energy consumption and carbon emissions related to its IT systems. The first focus was to target the most impactful application in terms of sustainability metrics. However, the ultimate goal is to extend the solution to the entire IT infrastructure, which presents a significant challenge given the size and complexity of Intesa Sanpaolo's IT systems. To tackle this challenge, a step-by-step approach was used, which involves identifying and prioritizing the most critical areas for improvement, implementing targeted solutions, and continuously monitoring and optimizing performance.
The two main KPIs that have been identified for the case of Intesa Sanpaolo are as follows:
● CO2eq: this metric measures the total amount of greenhouse gas emissions produced by the IT application and helps us understand the overall impact on the environment. This measure is relevant as it gives us a clear picture of the carbon footprint of IT.
● SCI: Software Carbon Intensity (SCI) measures the amount of carbon emissions produced per functional unit. This metric helps us monitor the efficiency of our software and identify areas for improvement. By reducing the SCI, we can make a significant impact on reducing our carbon footprint and promote sustainability.
To track the CO2 emissions of an IT system, it is necessary to calculate the total amount of energy consumed by the server (E) and then multiply that figure by the amount of CO2 emitted to produce that energy (I). The energy consumption of a server can be broken down into several major components, including the central processing unit (CPU), memory, and storage. NTT Data implemented a monitoring tool that measures the amount of CO2 emitted depending on resource use.
The results of the monitoring tool were made available in an internal dashboard to provide real-time insights to the decision makers. The "Carbon Calculator" dashboard provides Intesa Sanpaolo with a comprehensive view of their IT’s carbon footprint and resource usage. Through the dashboard, users can easily access emissions data for different periods and filter the data by services, offices, application, and environments. The dashboard provides real-time values for the current SCI, for CO2eq emissions in kilograms, as well as a percentage breakdown of emissions by resource usage. Additionally, the dashboard highlights areas where resources are consuming and producing the most emissions, allowing for targeted optimization efforts.
The tool offers the possibility to use different emission factors provided by CO2signal and WattTime according to the view and the scope of the calculations.

An additional use case currently under development merge the experience of Green Index and Co2 and SCI calculator.
After performing the static analysis to evaluate the codebase against the CISQ guidelines and assign the Green Index, the application is deployed. After this step, the team use the CO2e & SCI calculator to measure the carbon footprint and the SCI of the application in production.

Main benefits of the solution
Reduced carbon footprint: by tracking and measuring the energy consumption and carbon emissions of its IT systems, Intesa Sanpaolo can now actively identify areas and ways to reduce its IT carbon footprint. This is leading to a significant reduction in carbon emissions, helping the bank to achieve its environmental targets and contribute to a more sustainable future. However, this is only the start of a long-lasting process.
Cost savings: by optimizing its software and hardware usage for greater sustainability, Intesa Sanpaolo can also achieve significant cost savings. This is because reducing energy consumption and carbon emissions often goes hand in hand with reducing overall resource consumption, such as electricity and cooling, which can lead to lower operational costs.
Improved efficiency: the use of KPIs such as CO2eq and SCI enables Intesa Sanpaolo to monitor the efficiency of its software and hardware, letting it continuously identify areas for improvement, and implement changes to increase efficiency. This helps to reduce the bank's impact on the environment, but it also leads to improved overall efficiency and performance of its IT systems.
Bank’s ESG Reputation: Intesa Sanpaolo is demonstrating its commitment to sustainability and responsible IT practices. increasing customer loyalty, stakeholder engagement, and a positive impact on the overall brand reputation.
All of the actions mentioned are currently underway in Intesa Sanpaolo, as they are part of an ongoing process aimed at achieving sustainable goals across all aspects of the organization's IT. In the near future, these actions will be further intensified based on developments in the dashboard.
What was the outcome, how were carbon emissions reduced
The monitoring tool helped Intesa Sanpaolo to monitor and manage the carbon emissions associated with the IT services.
By optimizing these services for energy efficiency, Intesa Sanpaolo was able to reduce its carbon emissions while maintaining a high level of service quality.
In addition to reducing carbon emissions, Intesa Sanpaolo's collaboration with NTT Data also contributed to advancements in the issue of standard setting for software sustainability. By working closely with NTT Data, Intesa Sanpaolo was able to identify and adopt best practices for sustainable IT systems and share these practices with others in the industry.
The implementation of the monitoring tool and the adoption of sustainable IT practices is helping Intesa Sanpaolo to achieve its environmental targets and reduce its carbon emissions by a significant margin. This not only contributed to the bank's commitment to sustainability and responsible business practices, but also resulted in cost savings and improved operational efficiency.
Furthermore, Intesa Sanpaolo is continuing its process to achieve sustainability goals with NTT Data. Specifically, the bank aims to certify that the results of the NTT Data tool fully align with the GHG accounting standards in order to make these results available for its corporate sustainability report.
This article is licenced under Creative Commons (CC BY 4.0)
