Automated SCI Measurements with the Green Metrics Tool - A Use Case for Assessing Software Carbon Footprint
The Green Metrics Tool (GMT) is an open-source software solution designed to automate the generation of the Software Carbon Intensity (SCI) metric for a given software. It acts as a container native benchmarking tool, simulating typical software interactions and measuring parameters such as machine energy, CPU energy, and network traffic. In other words, the GMT mimics the software and inspects how much electricity the computer uses, how hard the processor (CPU) is working, and how much data is being sent over the internet.

Arne Tarara

By supplying specific input variables and instrumenting the software to output a unit of work variable, the GMT automatically calculates the SCI metric. Teams can integrate this instrumentation into a standard DevOps infrastructure as code, such as Docker compose files, and into a Git repository, enabling businesses to easily include carbon footprint assessments in their software development processes.
Limitations of the SCI as a starting point
When evaluating software energy efficiency, comparing the work with the total energy cost is common. The SCI takes this a step further by considering embodied carbon and current carbon grid intensity. Unfortunately, the SCI currently lacks a reference implementation in open-source software, making it challenging to derive, reproduce, and validate. Additionally, there’s no straightforward way to continuously track the SCI without automation.
An automated benchmarking approach
The solution to the problem involves using an automated benchmarking approach, which simplifies and helps to replicate the SCI metric consistently. The Green Metrics Tool is a free, open-source software that offers an initial implementation for automatically generating the SCI metric.
The tool provides the necessary software for local measurement setups. It offers reference hardware for running measurements with specialized hardware and software at no cost. To use the GMT, start with a Git repository and add a simple, well-documented usage scenario file. Submit the repository to the GMT cluster for automatic benchmarking. Users can run benchmarks at specified intervals, enabling detailed tracking of the software’s energy efficiency over time. Any changes to the software get reflected immediately in the published SCI score.
Wagtail - sample case
Wagtail is a popular open-source CMS based on Django, which comes with a detailed reference implementation: The Bakery. In a clone of the repository, we added the needed instrumentation files and defined the required SCI variables. To make it reproducible, we used the freely usable machines in the GMT measurement cluster and their respective lifetime and embodied carbon values.
As the unit of work in Wagtail, we defined R as the per-page visited since, as a CMS, its primary use is offering a framework that creates websites mainly visited by a browser. The SCI value we are calculating here, as an example, is the carbon cost per webpage viewed. The SCI score here is ~0.02 gCO2e/page request.
Exemplary SCI values for Wagtail page visits
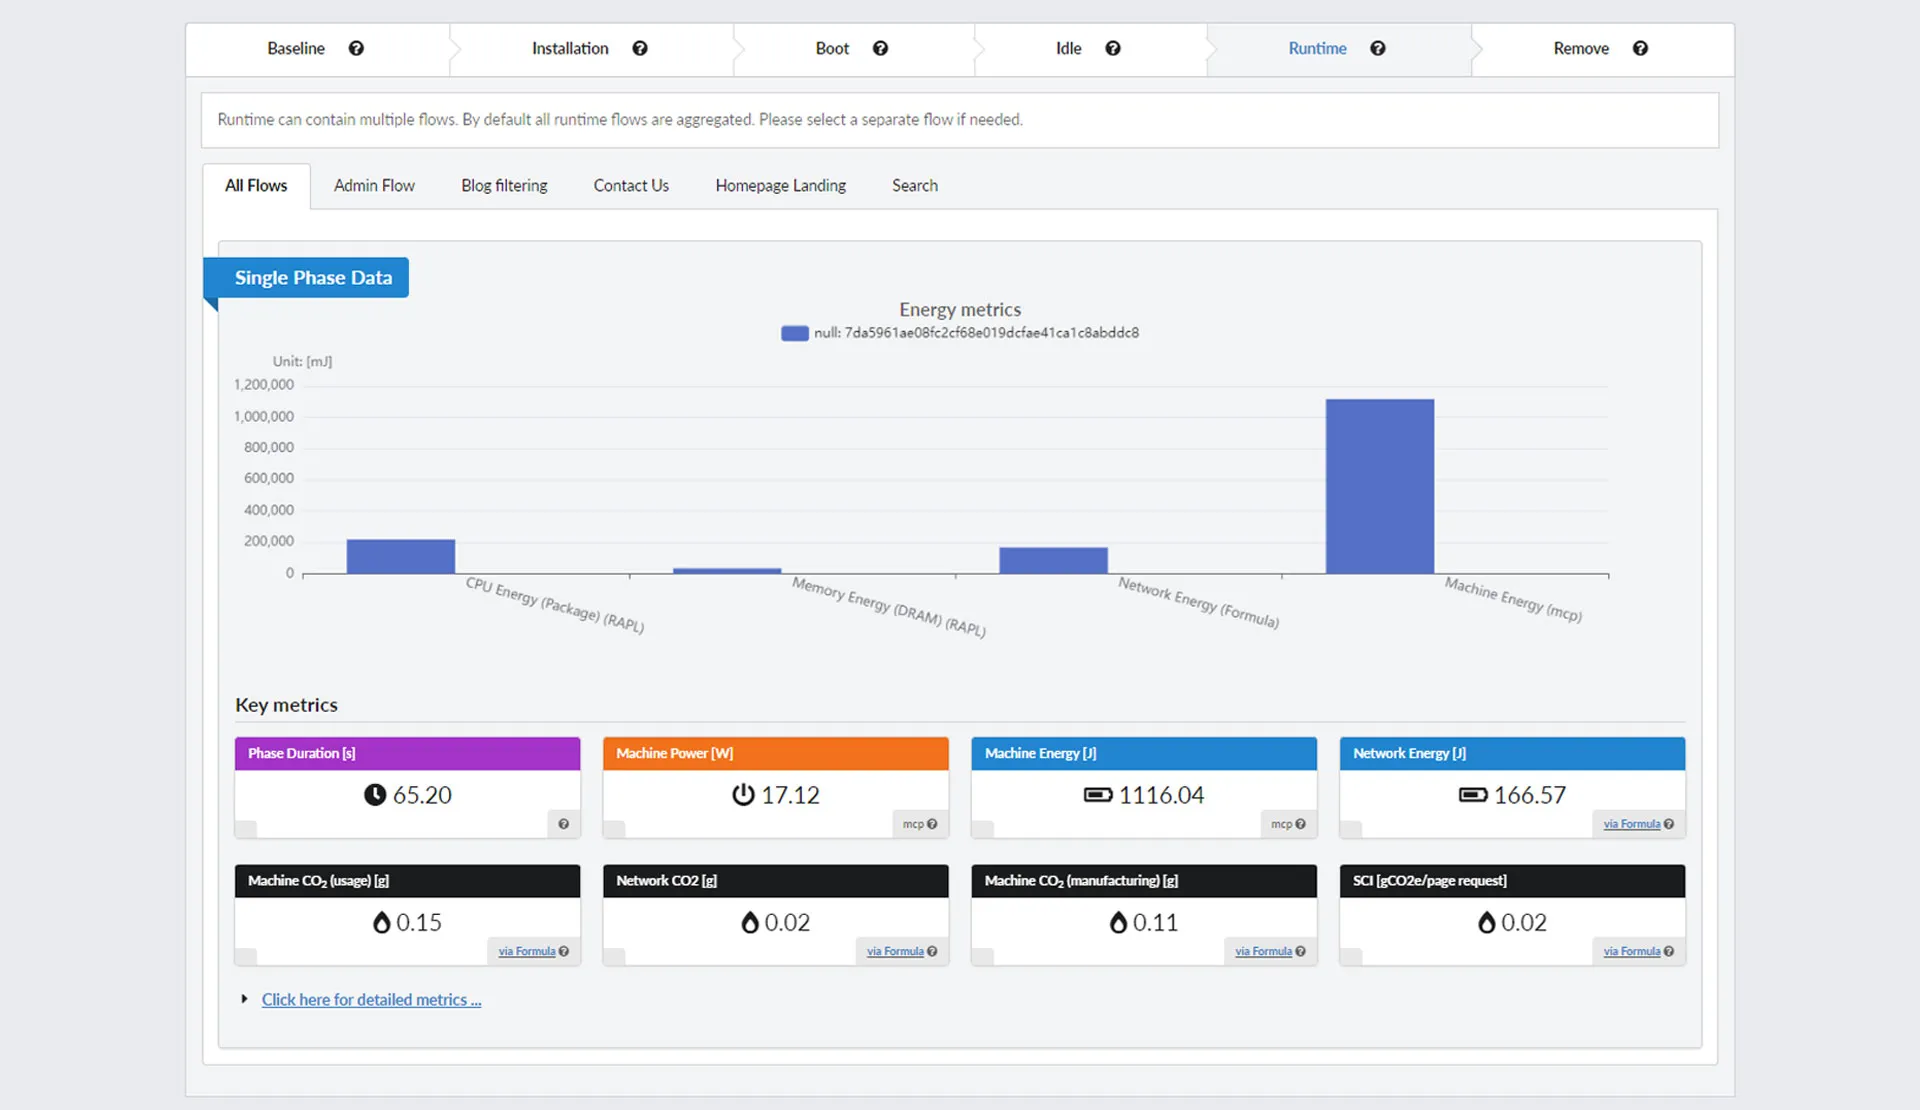
Case link: https://metrics.green-coding.berlin/stats.html?id=6e4936e0-2a78-4f5b-afe2-1299ed37a964
Nextcloud Talk - sample case
Nextcloud is a well-known open-source software that enables users to create a self-hosted platform similar to Google Workspaces. In this case, we employed standard Nextcloud Docker images to initiate a Talk session involving multiple users. We executed the scenario using Chrome browsers in headless mode. Once again, we utilized a machine from the freely available GMT measurement cluster to ensure reproducibility, along with associated lifetime and embodied carbon values.
The specific SCI calculated here is the carbon cost per Talk message, which resulted in 0.15 grams of CO2 equivalent per Talk message.
Exemplary SCI values for Nextcloud Talk
Case link: https://metrics.green-coding.berlin/stats.html?id=84645f34-2195-43e2-8c61-dcb3afe37120
The broad applicability of the tool
We have started to benchmark various open-source projects, aiming to track the development of the SCI over time and evaluate how design decisions impact these benchmarks. The effort also demonstrates the ease of integrating SCI into software. The monitored applications include Wagtail, WordPress, Django, and Nextcloud. You can find those projects here.
Other projects that demonstrate the broad applicability of the tool:
It’s important to note that energy consumption is not a static metric but a dynamic one. With a timeline of the software’s development, create badges to display how the software performs based on resource usage to elevate the SCI metric’s significance in the deployment process.
Why use automation to generate the SCI metric?
In today’s rapidly evolving tech landscape, the need for sustainable, energy-efficient solutions has never been more pressing. The SCI provides an easily digestible metric to get a first glimpse at your application’s energy and carbon profile. We can democratize access to this vital metric using open-source tools, allowing a wider community of developers, researchers, and institutions to leverage it.
The power of automation cannot be understated. With manual processes often proving cumbersome and error-prone, our software streamlines the process by automatically generating the SCI metric, which saves valuable time and ensures precision and consistency.
Did you know you can submit your own use case to the GSF? Here is how to get started.