Expanding the Toolkit for making software greener with Electricity Maps
To decarbonize software at scale, simplifying the power system's complexities and ensuring we have accurate data about emissions from the electricity grid is a key step. Thanks to Electricity Maps, this journey is about to get significantly better.

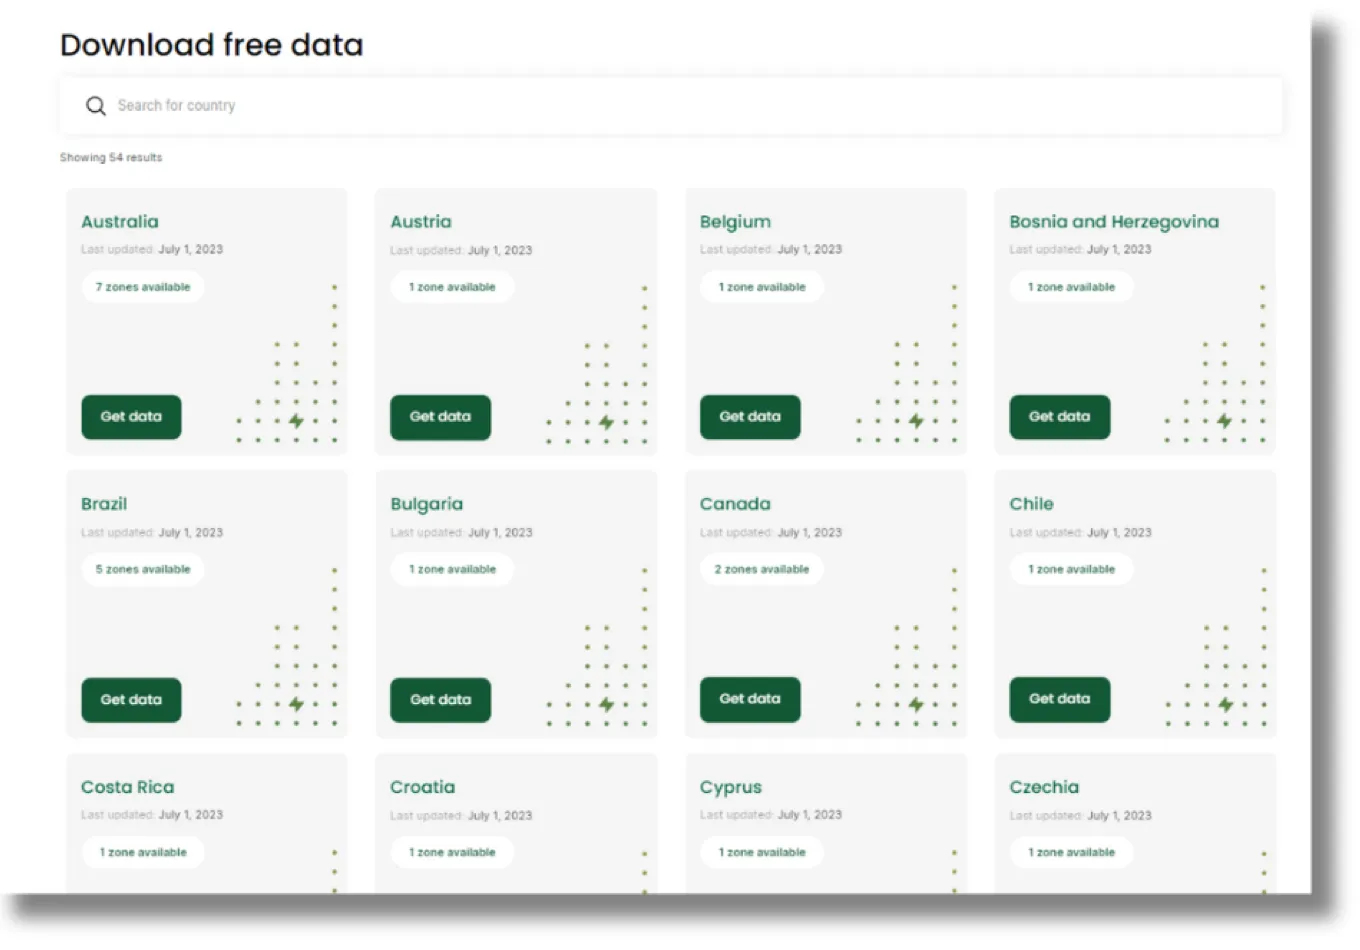
Recently, Electricity Maps launched an open-source Data Portal giving easy and free access to granular data on CO2 emissions from electricity consumption to every software practitioner. It’s a significant leap forward for our community, and here’s why.
The problem in a nutshell
Software teams are navigating substantial challenges and requirements when it comes to measuring the carbon emissions of their software and reporting on scope 2 emissions. These include:
Data Availability and Accuracy: This includes information on energy usage across various stages of software development, from code compilation to server operation.
Granularity of Data: To measure scope 2 emissions effectively, software analysts need granular data reflecting the carbon intensity (i.e., gCO₂eq/kWh) at the location of their data centers and the time of use.
Geographic Variability: Software projects often traverse multiple geographic regions, each with distinct energy sources and emissions profiles. Without data encompassing all (or most) implicated regions, carbon accounting remains inherently inaccurate.
Changing Energy Grids: Energy grids evolve over time, and the energy-mix of the grid can change as more move toward increased renewable energy. Keeping emissions data up-to-date to reflect these changes requires drawing comparisons between historical data and present-day data.
Regulatory Compliance: According to the 2023 State of Green Software report, there has been a 4X increase in software-focused legislation in the last decade, with 40% of countries introducing some form of regulation with greater focus on scope 2 emissions, which requires reporting on emissions associated with the generation of electricity, heat, or steam purchased and consumed.
Adding to the Solution Kit
Amidst these challenges, the new Electricity Maps Data Portal emerges as a potent addition to the software practitioner’s toolkit to green software. Offering historical data from 2021 and 2022, it covers over 160 zones across 60 countries. This wealth of data proves invaluable, especially for highly digitized companies.
When it comes to granularity, the data includes location-based carbon intensity based on direct emissions and life cycle analysis (LCA) of electricity consumption. Additionally, the renewable and low-carbon share of electricity consumption by hourly, daily, and monthly levels are offered.
Sending a clear message
In a world increasingly attuned to environmental concerns, harnessing open-source tools to enhance reporting conveys a powerful message to stakeholders, including customers and investors. Here’s how your company messaging will change:
-
Transitioning to cleaner energy sources and reducing emissions is your top priority.
-
You recognize how optimizing energy usage and shifting to cleaner energy sources can lower electricity bills, benefiting the environment, your customers, and your bottom line.
-
You choose to stay vigilant about regulatory compliance as more regions introduce rules and reporting requirements related to scope 2 emissions.
-
You are building a brand that lives environmental stewardship.
-
As the world transitions toward a low-carbon economy, applying state-of-the-art reporting tools on scope 2 emissions puts us in a leader position.
Open-source resources like the Electricity Maps Data Portal gives the industry greater momentum toward informed, sustainable, and environmentally responsible energy consumption. The way we look at it, making use of resources like this one does more than solve challenges in carbon accounting; it’s about the industry embracing the opportunity to shape a greener, more sustainable future to keep our planet bright in green and blue!